01 May BTC rejects technical level and breaks down
- Bitcoin pulled back from a long term trendline.
- BTC/USD has just turned positive after trading lower for most of the session.
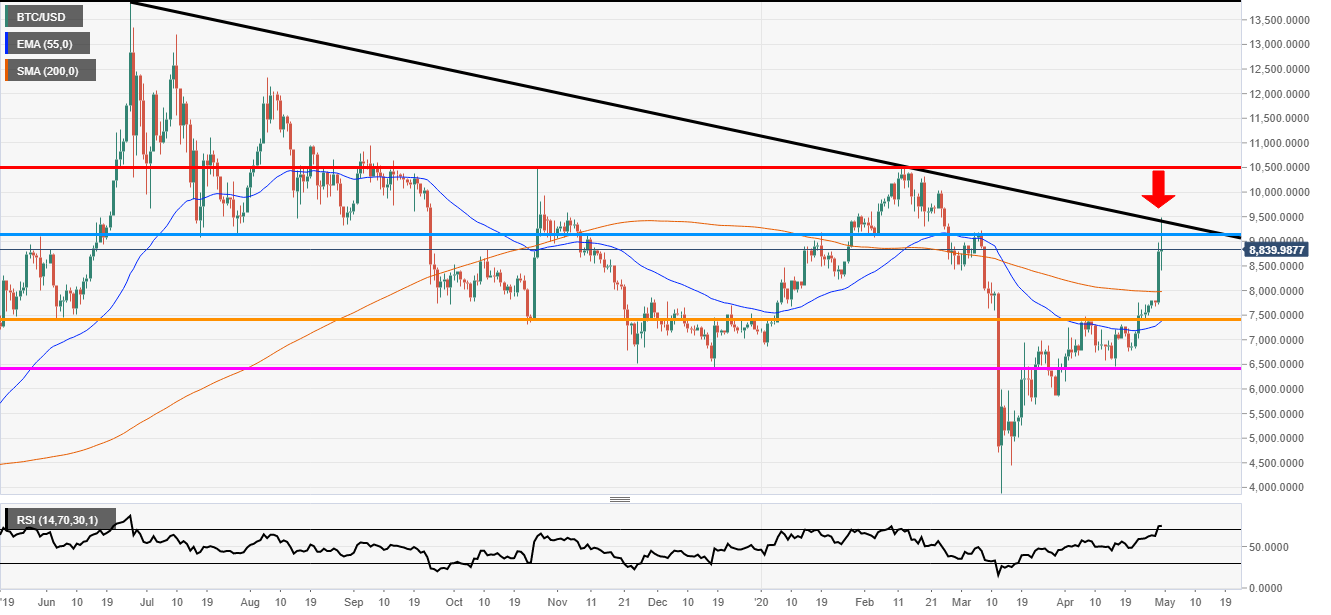
BTC/USD daily chart
Bitcoin had a massive Wednesday jumping over 13%. On Thursday, the market moved higher earlier in the session but since it dropped lower to hit a session low of 8,407.00. Now the price is trading just above flat and the bulls could be taking control again.
The price stopped at a key technical level. Looking at the chart the black trendline had been rejected and the price also stopped at the blue horizontal line at 9,152.00. Although it is not on the chart the price line is also close to the 50% Fibonacci level.
Now it is up to the bulls and bears to fight it out for dominance over this market. The bulls have the longer-term control as the market continues to make higher lows and higher highs. But this level does seem strong and it may take some decent volume to crack it.

Additional levels

