


19 May Bearish correction takes over after a string of bullish days
- BTC/USD is about to chart the golden cross pattern.
- XRP/USD is trending inside the green Ichimoku cloud
ETH/BTC daily chart
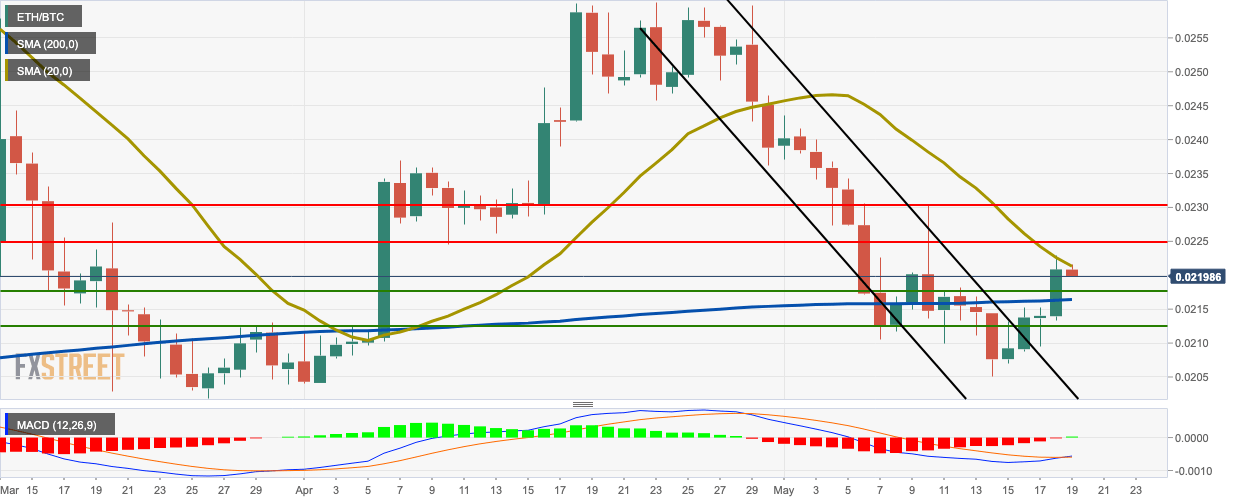
ETH/BTC went down from 0.0221 to 0.0219 following four straight bullish days. Current. ETH/BTC has encountered resistance at the SMA 20 curve. The MACD has reversed from a long period of bearish dominance to bullish.
ETH/BTC has two resistance levels on the upside at 0.02248 and 0.023. On the downside, there are three healthy support levels at 0.0218, SMA 200 and 0.0212.
BTC/USD daily chart
-637254499560187721.png)
BTC/USD dropped from $9,725,85 to $9,627.55 as the bears took charge after three straight bullish days. The SMA 50 is looking to cross above the SMA 200 and form the highly bullish golden cross pattern. The MACD shows sustained bearish momentum, while the Elliott Oscillator has had two straight red sessions.
There are two resistance levels for the bulls to overcome at $9,811.50 and $10,004.35. On the downside, the price has strong support…