


14 May Bearish correction begins following a heavily bullish Wednesday
- The ETH/BTC daily chart has had three straight bearish sessions.
- ETH/USD fell below the $200-level in the early hours of Thursday.
ETH/BTC daily chart
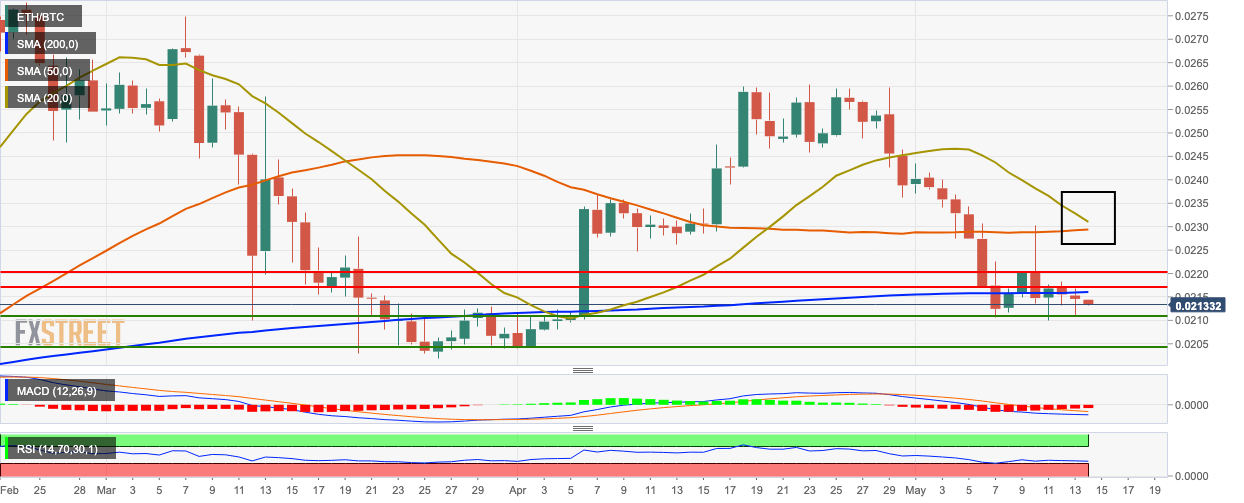
ETH/BTC dropped from 0.02145 to 0.02132 as the bears remained in control for the third straight day. The SMA 50 is looking to cross over the SMA 20 and form the bearish cross pattern. The MACD shows sustained bearish momentum, while the RSI indicator is trending horizontally next to the oversold zone.
The bears must defend support levels at 0.0211 and 0.0204. On the upside, the bulls will need to cross above resistance at SMA 200, 0.0217 and 0.0202.
BTC/USD daily chart
-637250198305521785.png)
BTC/USD dropped a bit from $9,320 to $9,300 following a hugely bullish Wednesday. The Elliott Oscillator has had five straight red sessions, while the MACD shows sustained bearish momentum. The 20-day Bollinger jaw has narrowed, which indicates decreasing price volatility.
The price faces two resistance levels on the upside at $9,500 and…